WIF price falls, whale buys the dip, CEX reserves fall, risks remain
Jan 11, 2025
Dogecoin
Dogwifhat price crashed below the key support at $2 this week, mirroring the performance of Bitcoin and other Solana meme coins.
Dogwifhat , one of the largest meme coins on the Solana network, tumbled to a low of $1.8520, marking a drop of over 61% from its peak in November.
The decline in WIF’s price is tied to the broader crypto crash that has seen Bitcoin (BTC) and most altcoins retreat. The total market cap of these coins fell from $3.6 trillion last week to $3.3 trillion today as risks in the bond market continued.
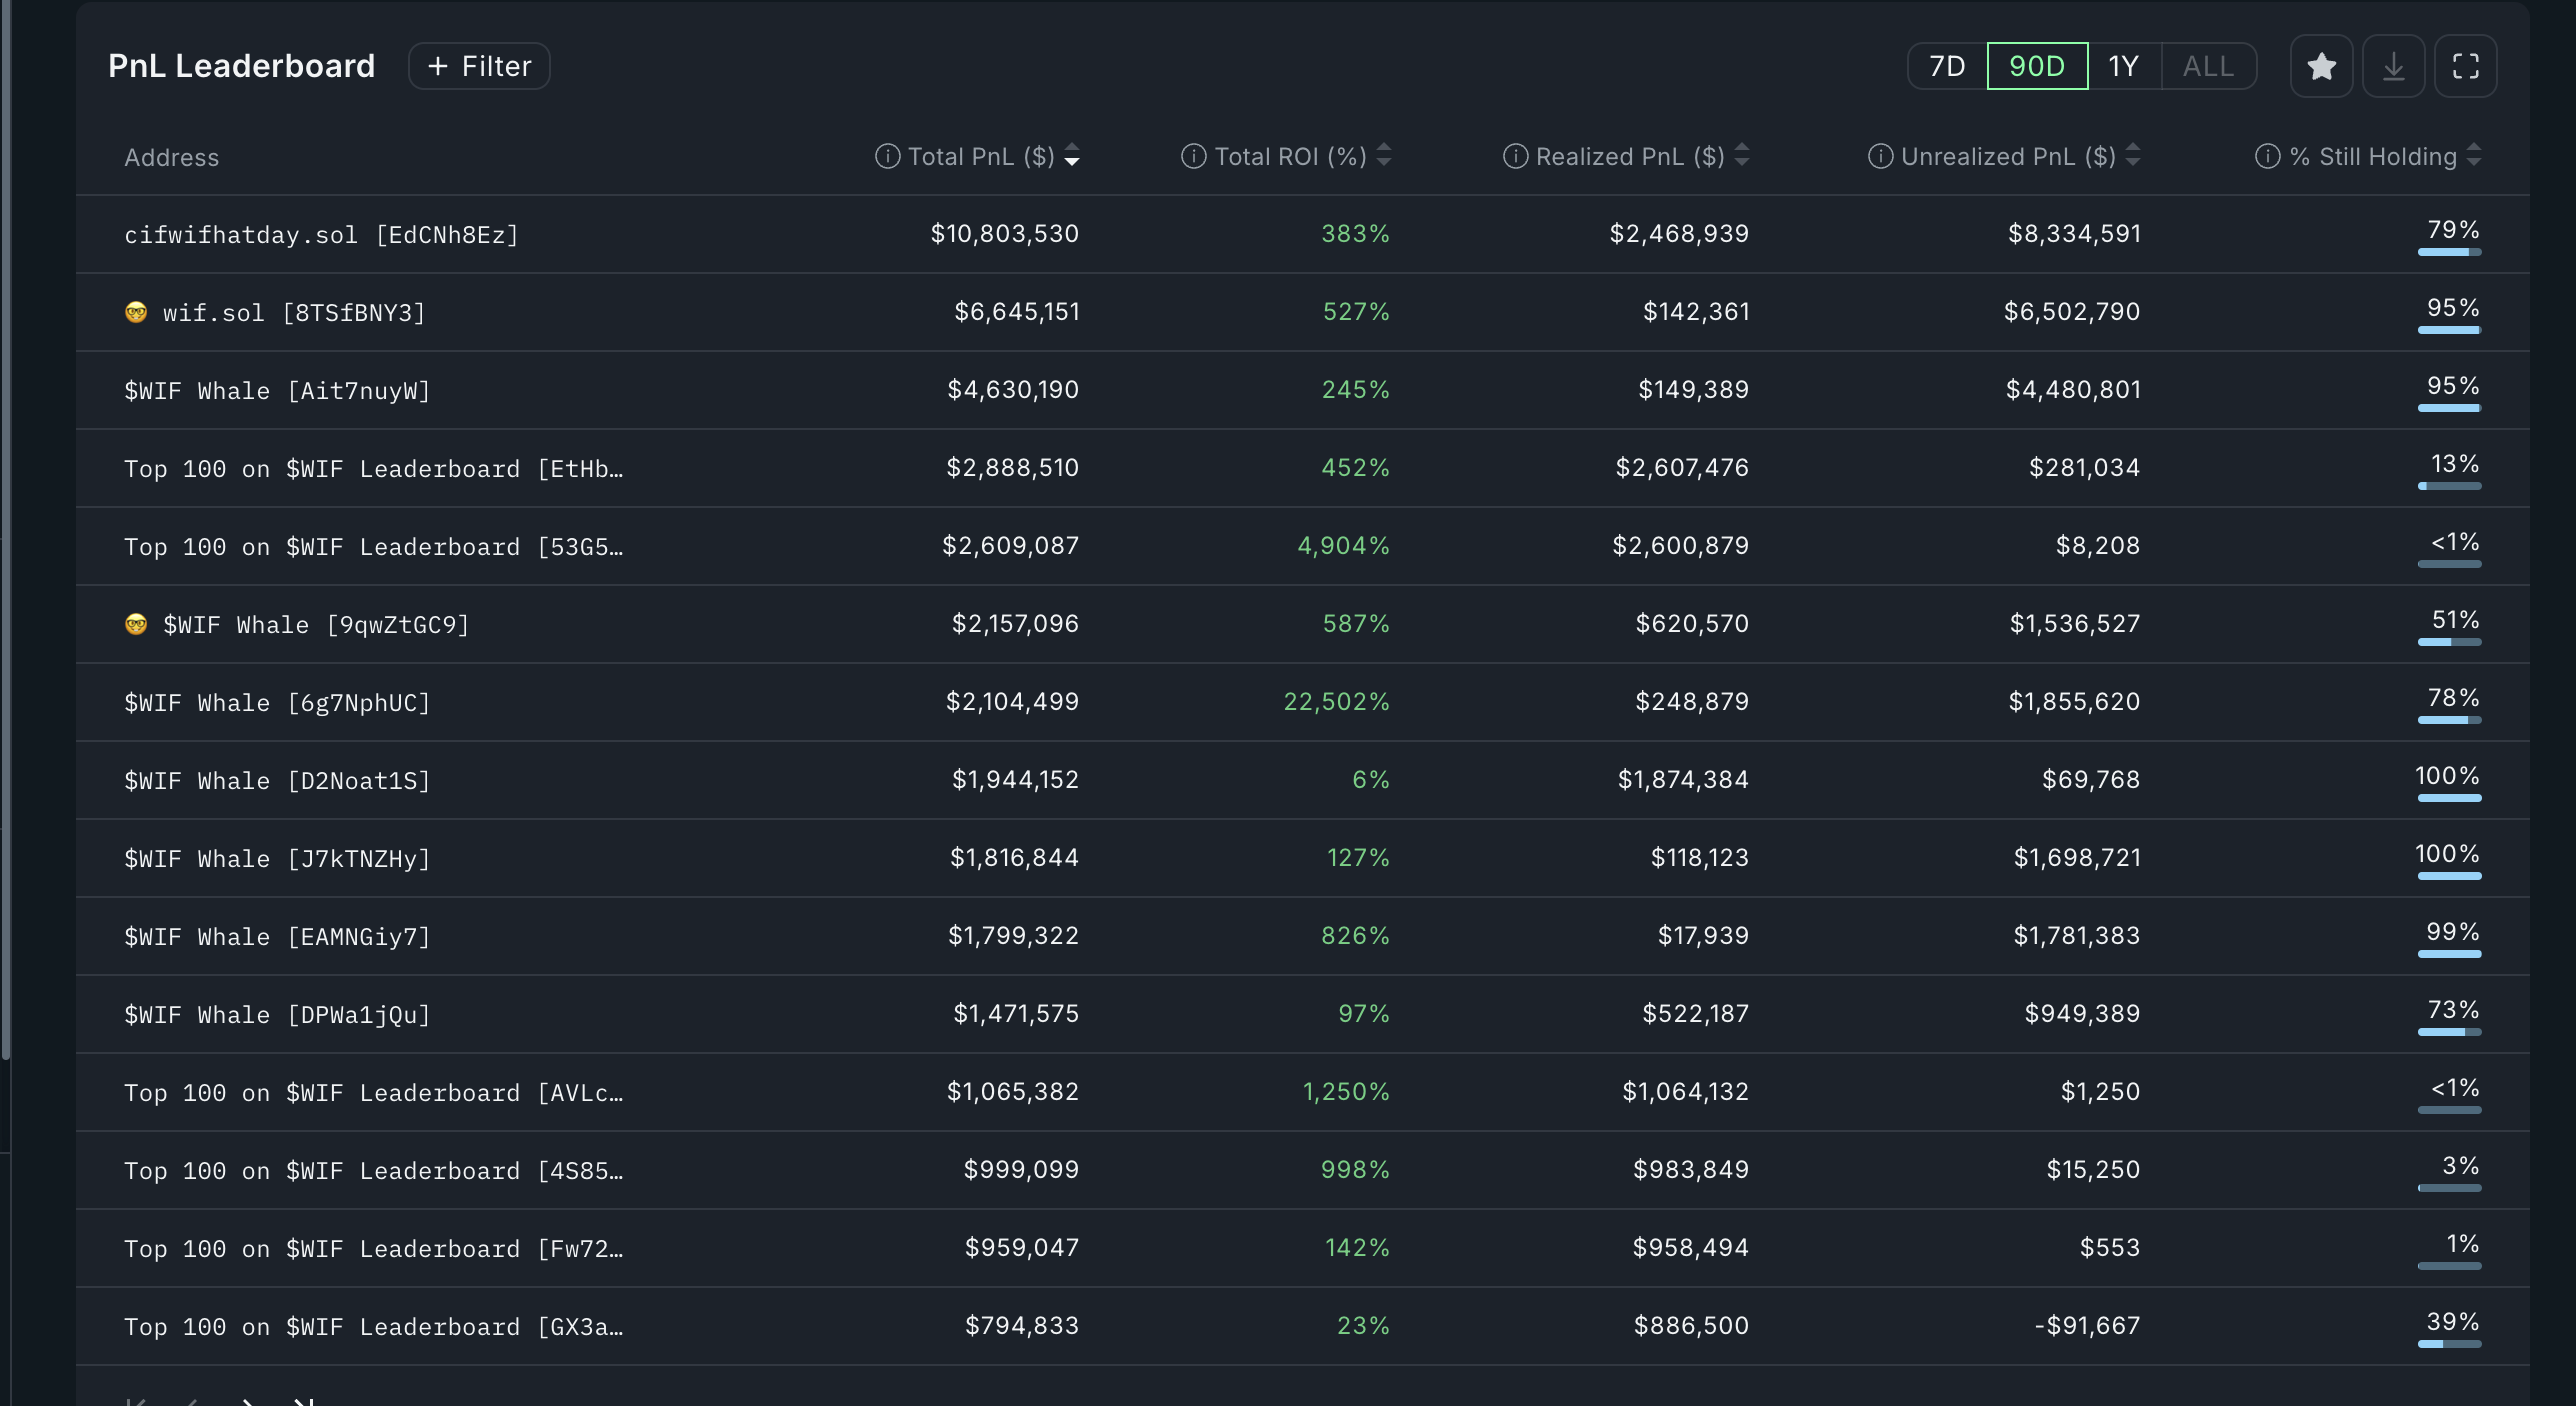
WIF also dropped as some investors took profits from the recent rally. Nansen data shows that several top WIF investors have begun cashing out. The leading investor has earned $10.8 million in profits and sold $2.4 million worth of his holdings. As illustrated below, other top investors have also offloaded a significant portion of their tokens.
One WIF whale remains optimistic about a rebound once the market stabilizes. According to LookOnChain, the whale purchased 7.25 million WIF tokens valued at $13.34 million on Tuesday. Additionally, the same investor bought other Solana meme coins, including Popcat, Fwog, and Michi, indicating that he expects a recovery in the meme coin space.
Meanwhile, data from Nansen shows that more WIF tokens are being moved off exchanges, which is generally seen as a positive sign. The number of tokens held on exchanges dropped to 433.28 million, down 0.32% from the previous week.
The total supply of WIF on centralized exchanges has also decreased by 0.17% to 43.22% over the same period. As shown below, the token recorded an outflow of $24.1 million from centralized exchanges in the past 24 hours, which is ten times higher than the recent average.
Tokens leaving exchanges is a good sign since investors are optimistic that it will bounce back once the ongoing crypto rout ends.
WIF price analysis as it sits at a key support
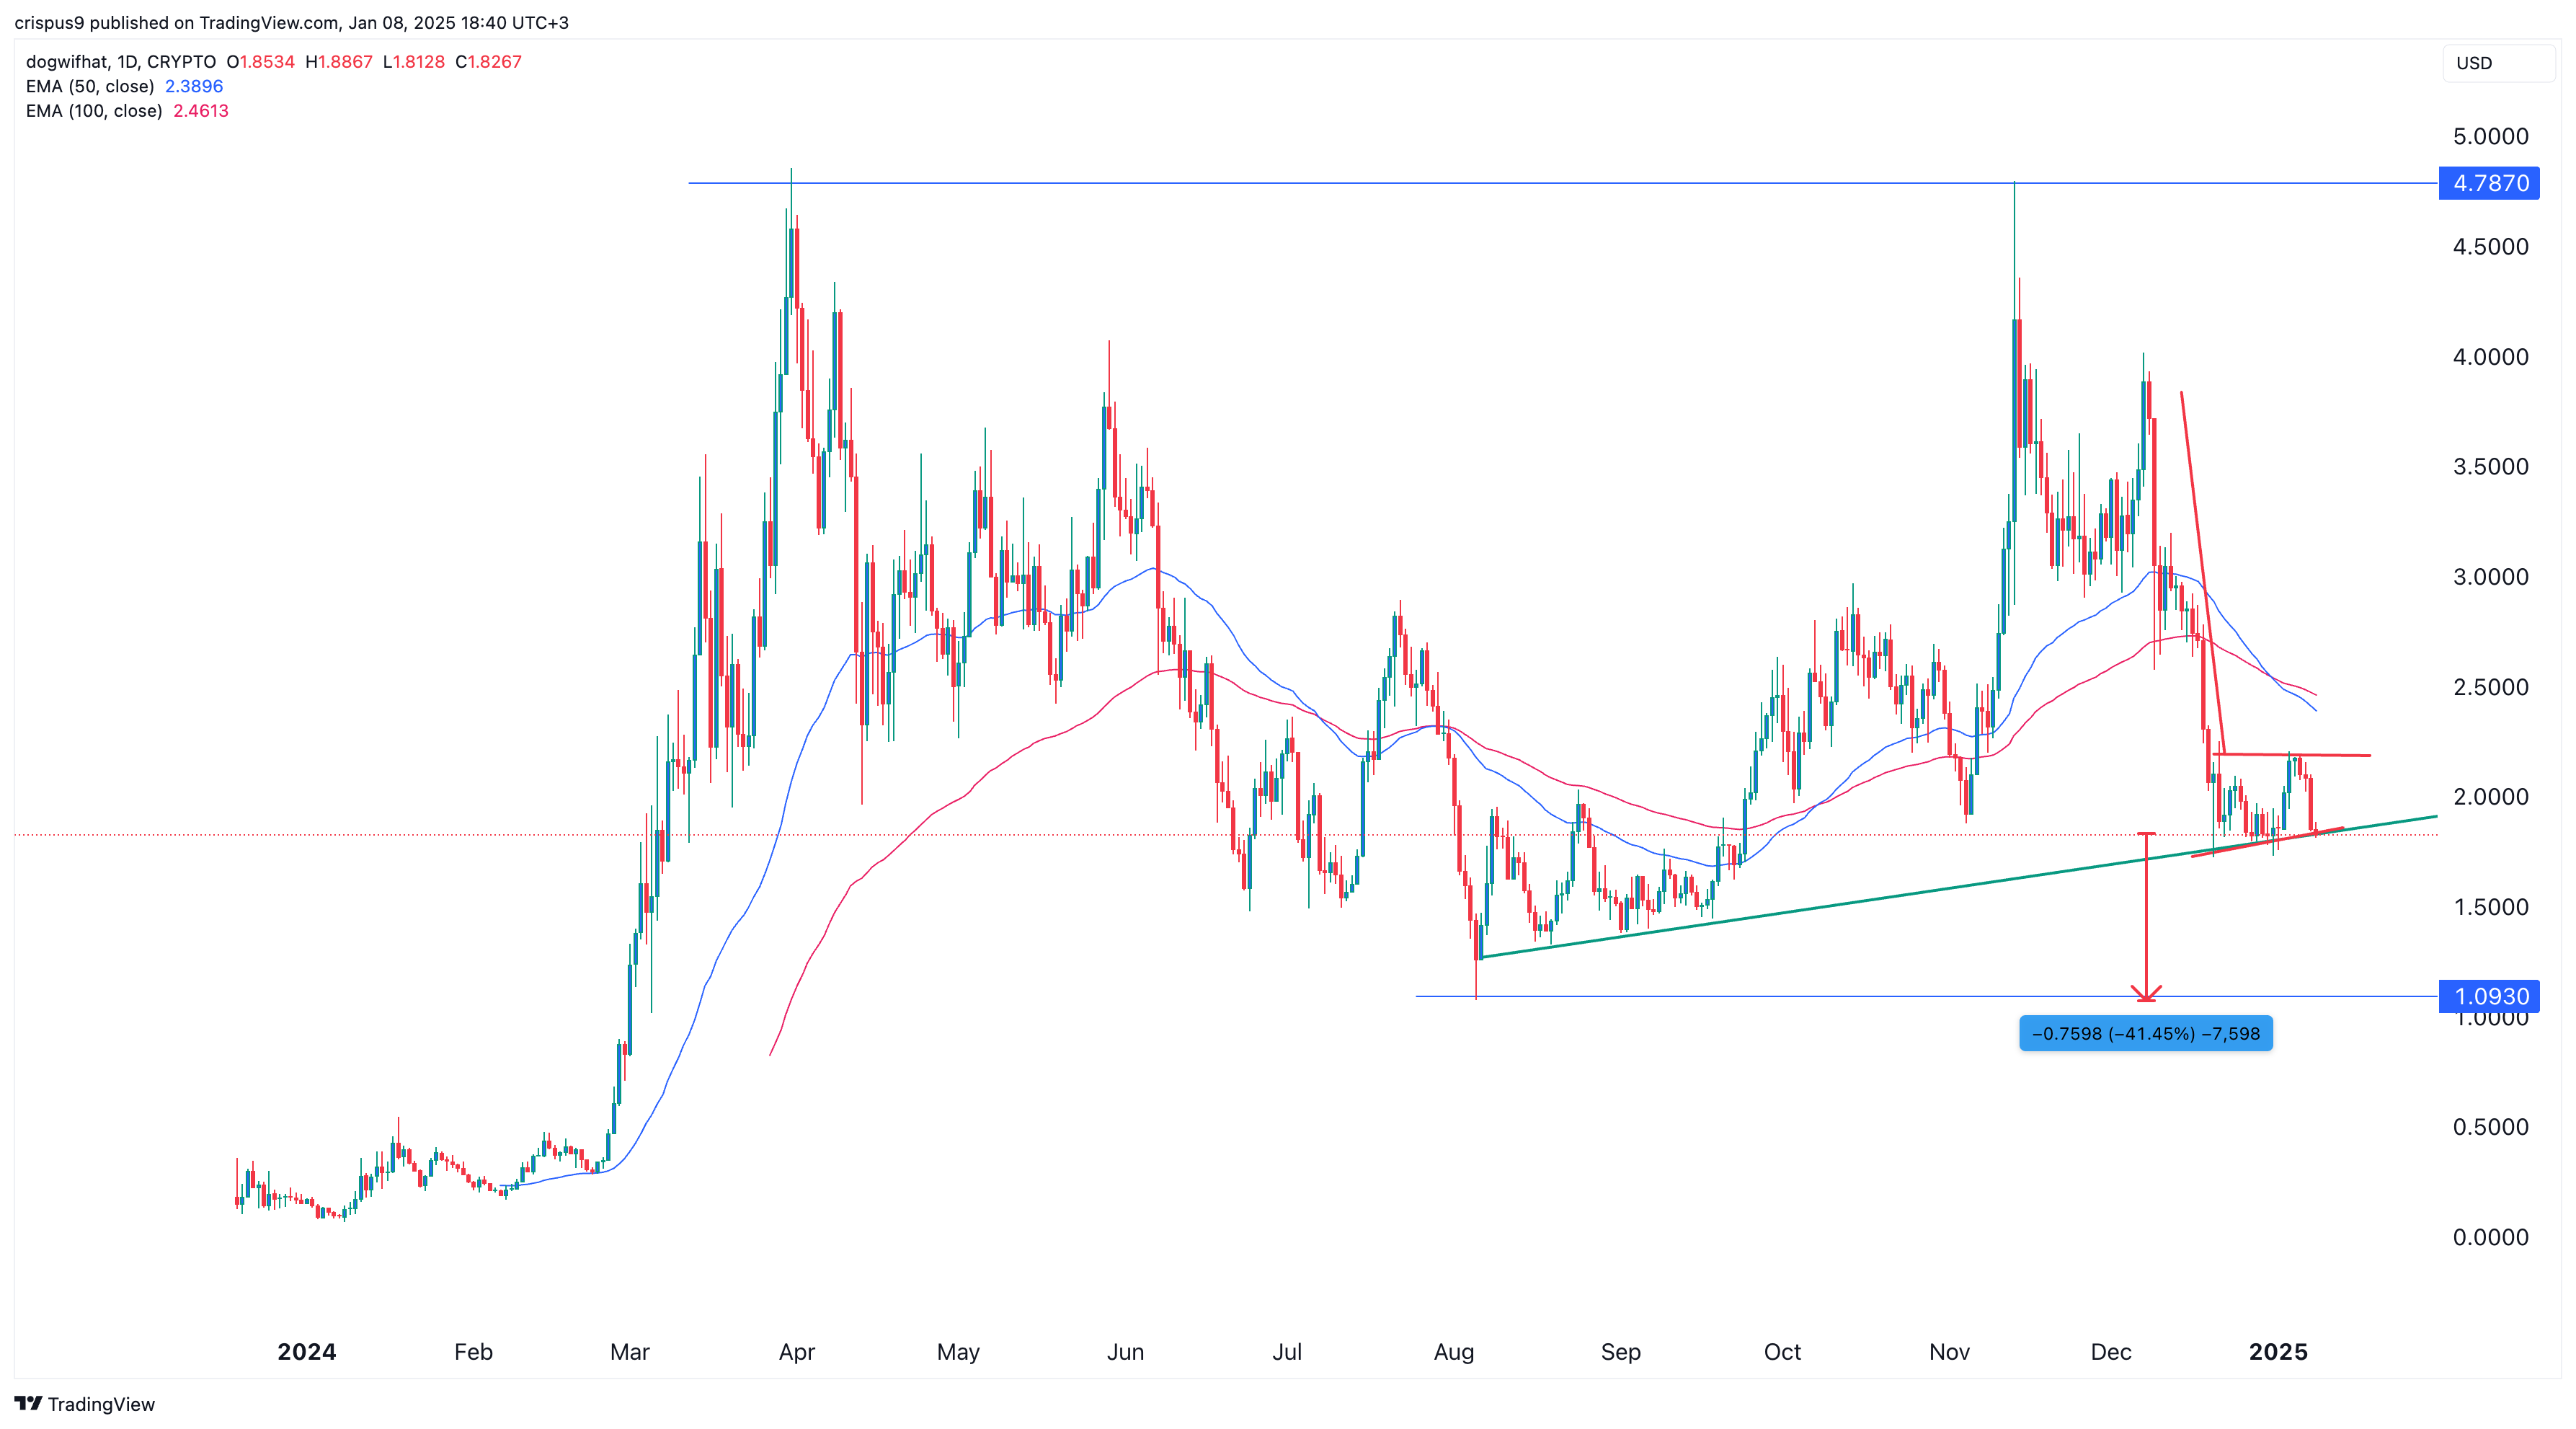
The daily chart shows that Dogwifhat has been in a strong downtrend since peaking at $4.7870 on Nov. 13. The price has now pulled back to $1.82, an important support level that aligns with the lowest swing point from August last year.
The coin’s 50-day and 100-day moving averages have formed a bearish crossover. It has also formed a bearish flag chart pattern consisting of a long vertical line and a rectangle-like pattern.
Additionally, the price chart shows a double-top formation with a peak at $4.78 and a neckline at $1.093. This pattern suggests a potential bearish breakout, with sellers likely targeting the next major support level at $1.093, which is 43% below the current price.
Recommend Apps


Preview: