When will altcoins rally in 2025? An on-chain analysis of Bitcoin bull run and market cycle
Jan 09, 2025
Dogecoin
Altcoin season index and analysis of Bitcoin dominance
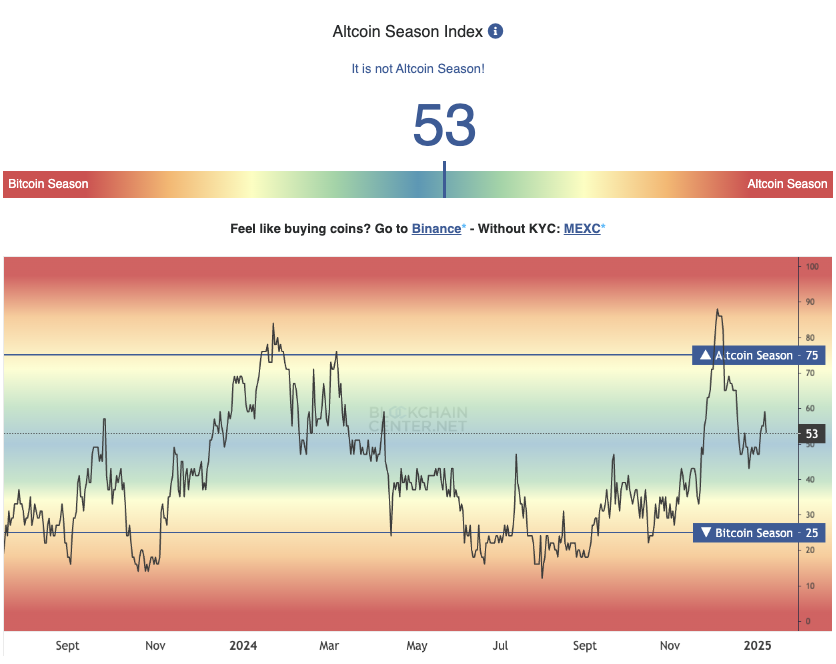
Blockchaincenter.net’s altcoin season index reads 53 on a scale of 0 to 100. The index implies that it is not the altcoin season yet, a period characterized by top 50 altcoins outperforming Bitcoin for 90 days.
An analysis of Bitcoin’s dominance and the crypto market capitalization excluding BTC can be used to determine whether the altcoin season will return anytime soon. BTC dominance is consolidating under 58%, as of Tuesday.
Crypto market capitalization, excluding BTC, dipped to $1.41 trillion early on Tuesday, down from its peak of $1.64 trillion observed in December 2024. Even as total crypto market capitalization shrinks, it holds steady above support and technical indicators on the daily timeframe paint a bullish picture.
A steady increase in crypto market capitalization, excluding Bitcoin, rallying towards the 2021 cycle top to the $1.71 trillion level could signal a recovery in the market and a likely return of the altcoin season.
On-chain analysis of top altcoins on exchanges and token holders
Supply of Bitcoin and top altcoins like Ethereum on exchanges can help ascertain the selling pressure on the tokens. The total number of holders is another key on-chain metric that can be used to determine the demand and relevance of an altcoin among traders.
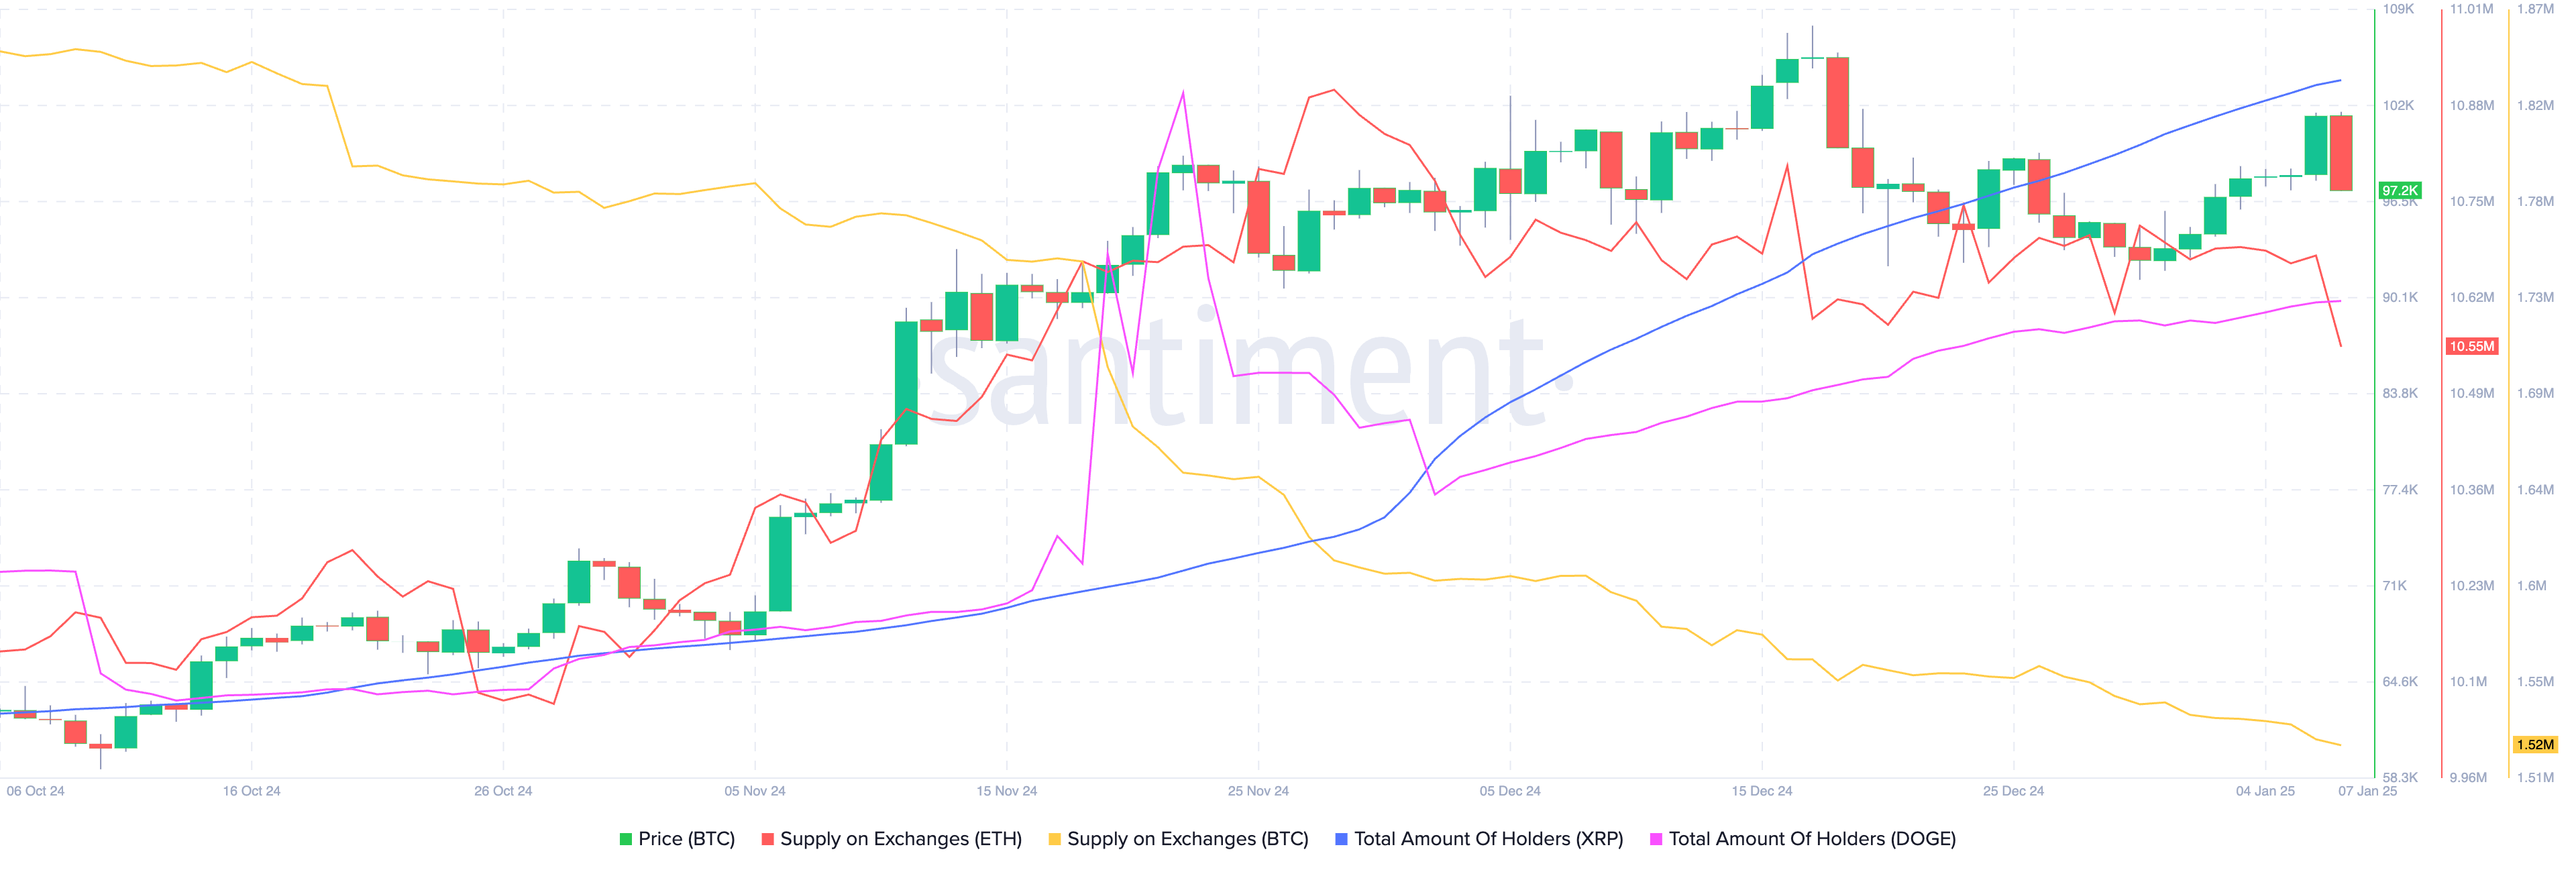
The Santiment chart below maps the total number of XRP and Dogecoinholders over the past three months.
The chart points to a decline in Bitcoin and Ethereum’s exchange supply since the last week of November 2024. In the same timeframe, there is a consistent increase in the holders of XRP and DOGE.
Alongside reducing selling pressure, there is high interest and demand for altcoins on exchanges. This is a key indicator for predicting whether altcoin season is expected to return in the ongoing market cycle.
Whale stablecoin supply and what to expect this cycle
Stablecoins are the entry and exit points for traders across centralized crypto exchanges. This makes stablecoins the doorway to crypto, and the metric that tracks stablecoin supply helps identify demand for crypto.
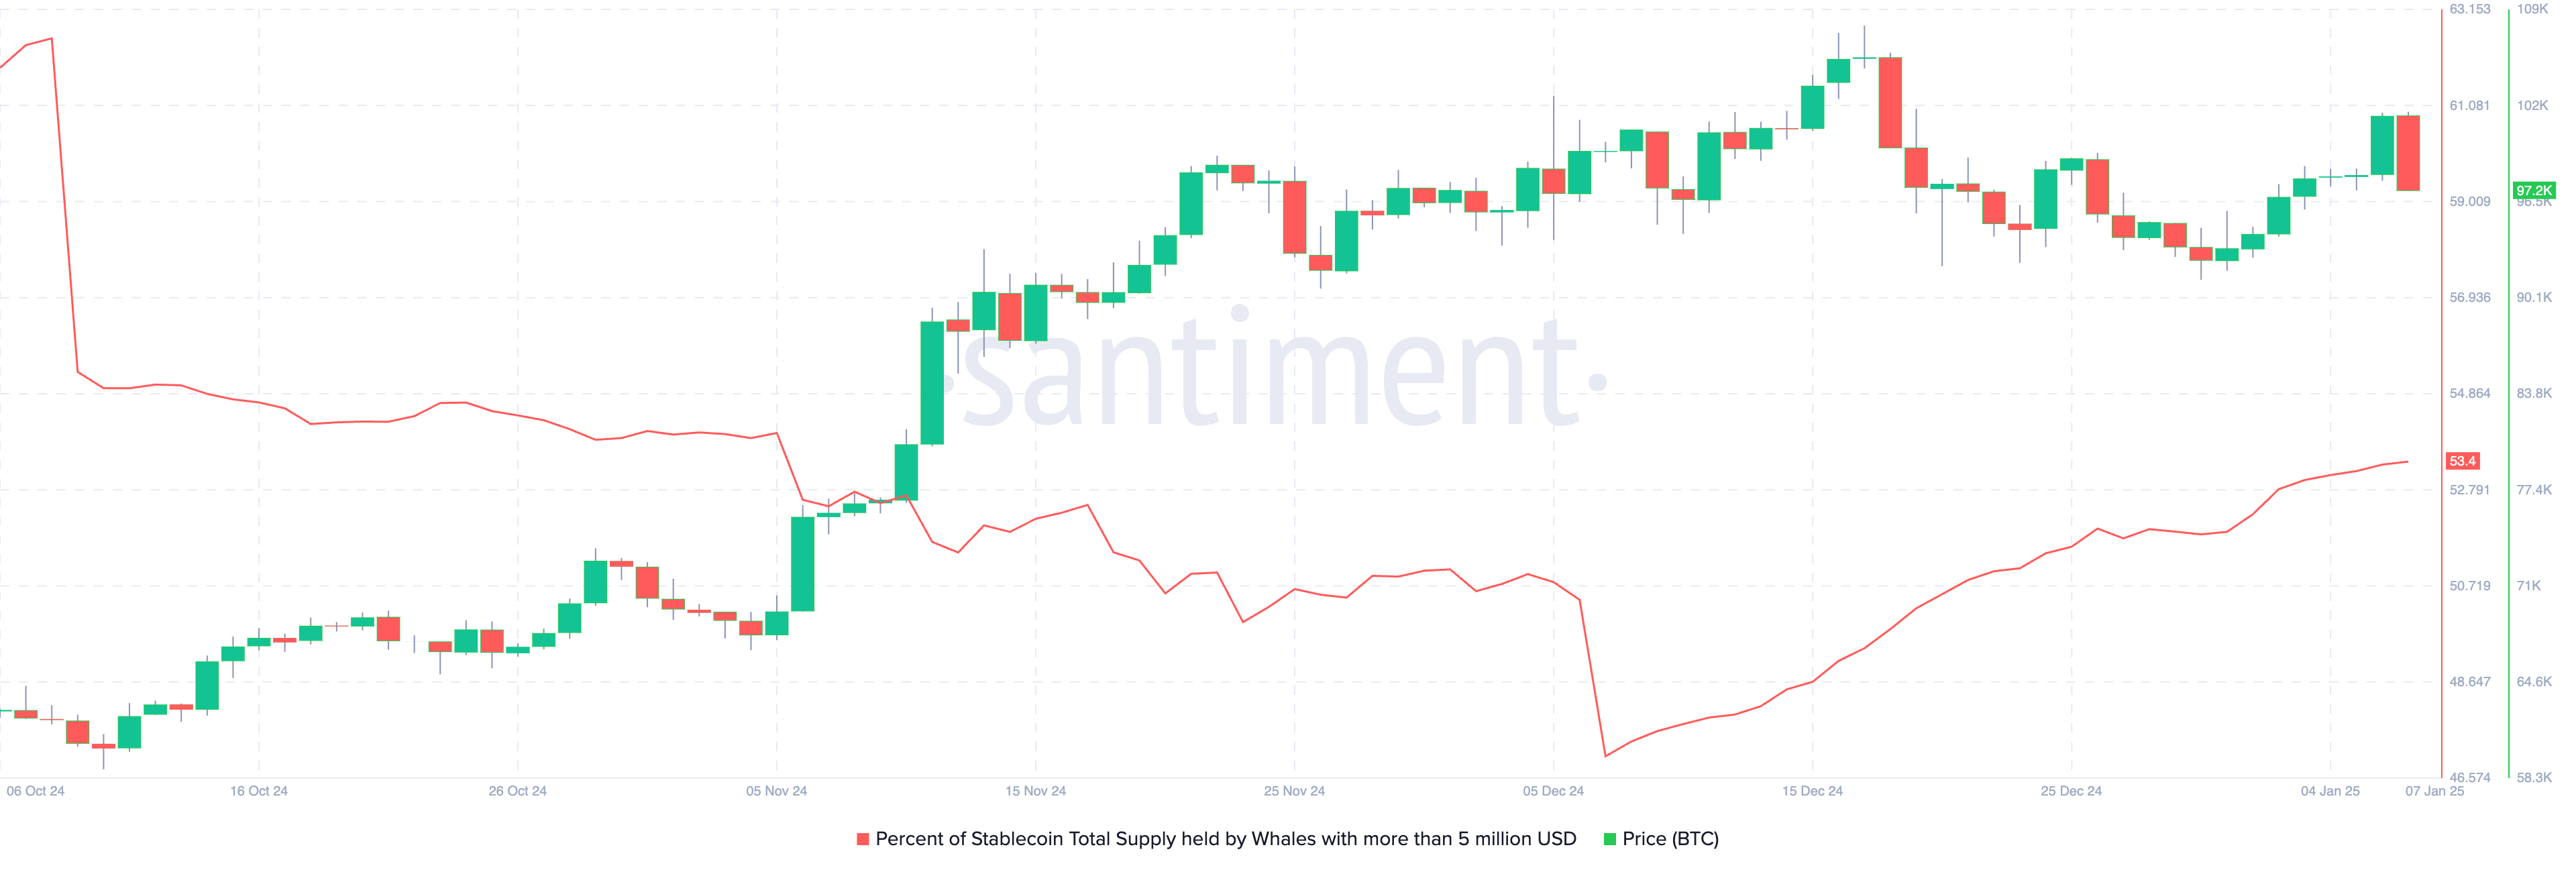
Santiment data shows stablecoin supply held by whales holding upwards of $5 million has risen over 5% in the past 30 days. Higher stablecoin holdings are correlated with higher buying pressure and demand for Bitcoin and altcoins.
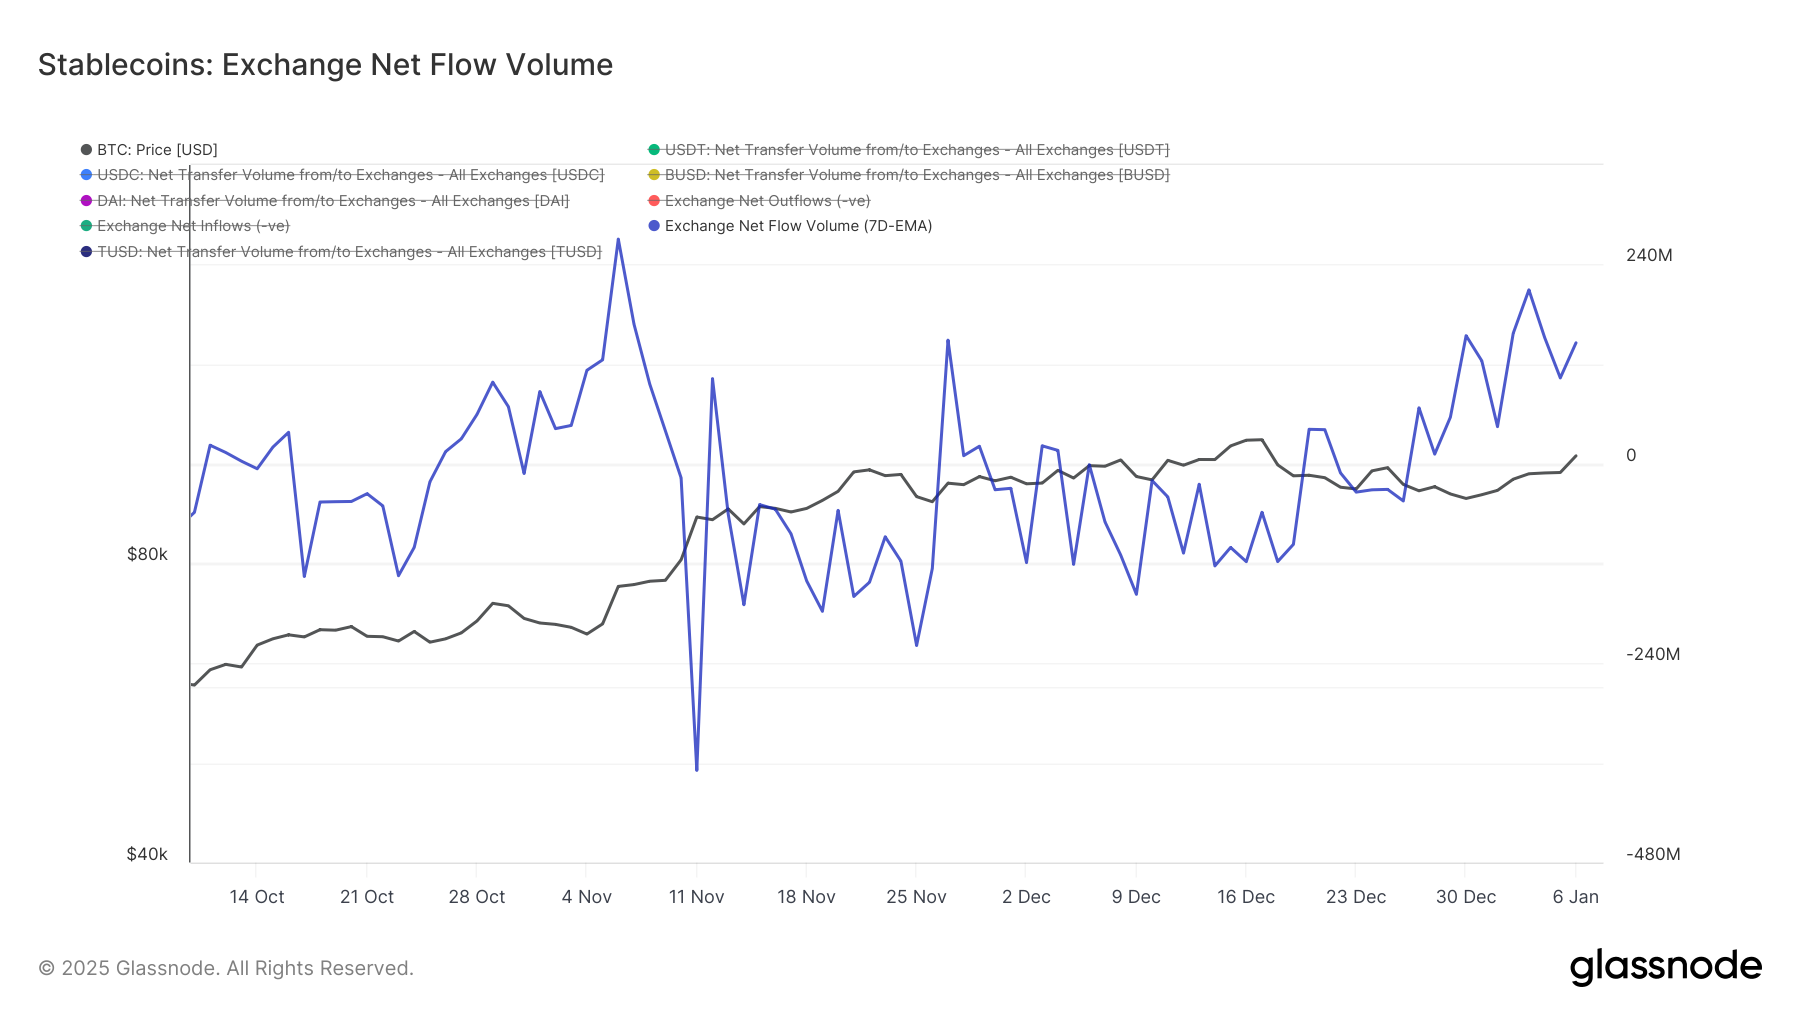
Glassnode shows that stablecoin exchange net flow is in an upward trend since December 9. There have been consistent spikes in net flow to exchanges, representing the demand for Bitcoin and altcoins across centralized exchange platforms.
The chart tracks Bitcoin price alongside stablecoin net flows, consolidating near the key support level at $100,000.
Institutional interest returns to crypto
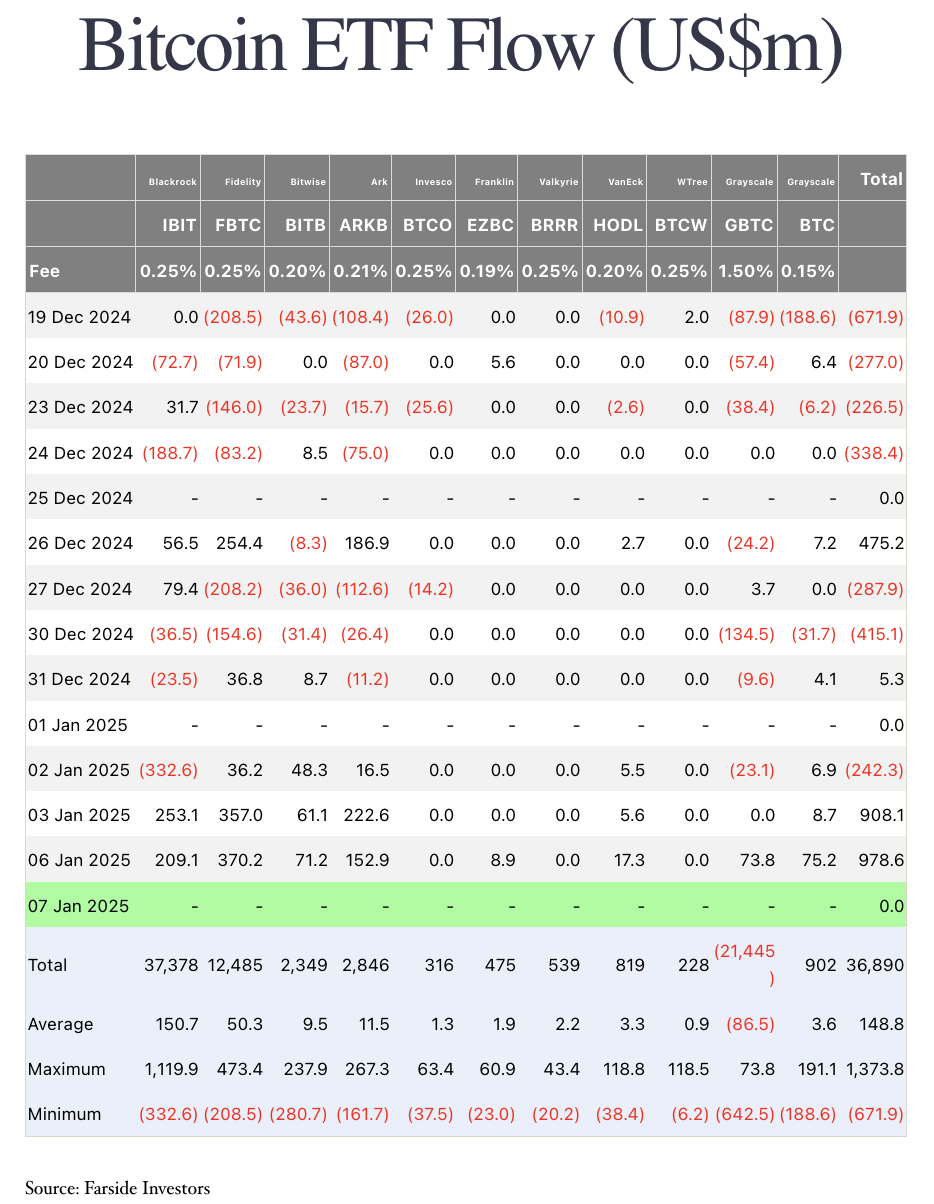
One of the major drivers of Bitcoin bull run in 2024 was institutional capital inflow to U.S. based Spot Bitcoin ETFs. After a long streak of outflows, Bitcoin ETFs have observed a return of capital inflow from institutional investors.
Farside Investors’ data shows that on January 3 and January 6, net flow to Bitcoin ETFs exceeded $900 million. On January 3 it was $908.1 million and on January 6 it was $978.6 million.
The return of institutional interest and U.S. macroeconomic drivers could help sustain Bitcoin price above the $100,000 milestone.
A K33 research report titled “Ahead of the Curve”, published on Tuesday, identifies strong new year ETF flows even as MicroStrategy slows down its Bitcoin purchasing spree. The past two trading days recorded the strongest days of institutional capital inflow since November 12.
It is likely that the influx is driven by the pre-Trump inauguration positioning of firms or 2025 mandates for funds to invest, MicroStrategy’s small weekly Bitcoin purchase of 1,070 BTC failed to dampen trader sentiment on Tuesday.
The report concludes that smaller ticket-size BTC purchases by MicroStrategy have been compensated by strong Bitcoin price performance and the rising ETF demands, signalling a robust crypto market.
Top 3 trades for the 2025 altcoin season
Solana (SOL) holds steady above the milestone of $200 and traded at $206 on Tuesday. Technical indicator: The Moving average convergence divergence indicator supports a bullish thesis for SOL.
MACD flashes green histogram bars above the neutral line, the MACD line recently crossed above the signal line, meaning SOL price trend has an underlying positive momentum. The relative strength index reads 50, above the neutral level.
SOL could extend gains by 12% to test resistance at $231.62, the 78.6% Fibonacci retracement of the rally from $110.51 low to the 2024 peak of $264.59.
Recommend Apps


Preview: